
With a quill pen and some parchment paper, Isaac Newton, in a single summer, created calculus AND unraveled much of the mystery of the physical laws that drive the universe. Several hundred years later, Albert Einstein – who allowed as how he did it standing on Newton’s shoulders – figured out much of the rest of the universe’s operating secrets.
But neither of them, even if they had the time and the inclination (and were still among the living), could have determined with certainty which way the markets will go for the next day, week, or month. In fact, such certainty would be impossible because if we knew when the market was going to continue in its current direction, or was about to change direction, there could be no trades since no one would be willing to take the “other” side of the trade.
So we must deal with directional and timing clues that others have worked out over the years – and stand on their shoulders, so to speak – in order to at least put the mathematical probabilities in our favor.
Which brings us to SaferTrader’s Monthly Income Machine approach to technical indicators for overbought and oversold, i.e. judging, and profiting from, a market that is likely to change direction.
Just as a bedrock assumption supporting selling credit spreads and Iron Condors is that option time decay gives us a huge advantage over outright purchasers of an option in terms of mathematical likelihood of being profitable, conservative investors should always be alert to specific techniques that can further tilt the probabilities in our favor.
There are a myriad of technical techniques that have been developed over the years to give an investor insight into possible “turning points” in market direction, i.e. situations where a stock or an index is very much overbought or oversold and is likely to change direction.
My favorite is one that has stood the test of time and, together with a simple filter I suggest using with it, may well provide a real boost to your “Machine” profitability by providing you with an additional edge over and above the “entry criteria” we use for all trades.
The overbought/oversold indicator I like the most is the Williams %R, a predictive technical indicator based on oscillator analysis.
To see how Williams %R, together with a simple moving average filter and standard support/resistance charting, can supercharge things, let’s go through an example using Williams %R and AAPL back when this article was being written.
Using Williams %R
Williams %R depicts in graph form the current closing price relative to the high and low points of the past N days (usually 10 days).
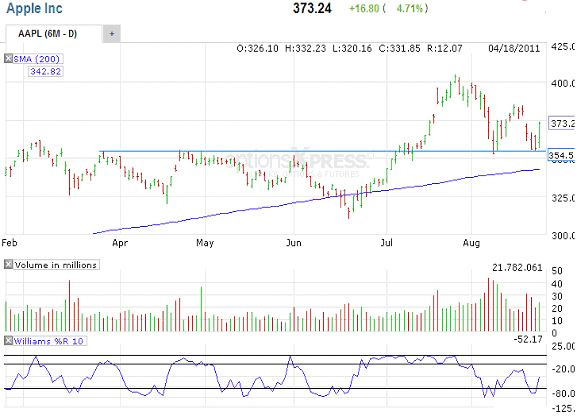
The Williams %R graph is the very bottom section of the graph above.
The William %R scale is the lower right side of the graph marked with values from –100 to 0 (and you ignore the minus sign). The interpretation is that extreme upper range readings from 10 to 0 indicate a “very overbought” market, and extreme lower range readings from 90 to 100 scream “extremely oversold.”
Notice that there is a remarkable correlation between what happens to the price of Apple when the Williams %R touches a very extreme high or low point and then “turns” away from the extreme:
- Hit 0 toward the end of February, indicating very overbought… and the price of AAPL immediately started down,
- Hit about 90 mid-April, indicating very oversold… and the price of AAPL then turned up.
- Hit 0 beginning of June (very overbought), and AAPL price began dropping immediately.
- Hit about 90 again now in late August, and AAPL obediently rose sharply.
But bear in mind that no indicator is, or ever will be, perfect: Notice that toward the end of June the indicator kept bouncing on the 0 line – indicating very overbought – but AAPL not only did not go down, it kept rising ferociously. This is yet another example of why EVERY The Monthly Income Machine trade should have a MRA (Maximum Risk Amount) associated with it… and although the MRA comfort level reflects each investor’s risk tolerance decision, we recommend risking no more than about 1.5 to 2.0 times premium received on a trade before taking corrective action.
Adding the Filters Can Further Strengthen Your Trade!
(A) 200-Day Simple Moving Average (SMA)
Trades do not take place in a vacuum. We start with a series of “entry criteria” to confirm that a potential trade meets all the entry rules of distance from the current market, minimum premium, absence of earnings report prior to expiration, Delta (mathematical likelihood of option expiring worthless), etc.
There will be more than one possible trade that fits The Monthly Income Machine entry criteria… but wouldn’t it be nice to identify one that is a market that is in an Up Trend, but ALSO happens to be oversold at the moment?
If we limited our trades to those where our credit spread is in the direction of the general trend, the already powerful predictive ability of Williams %R may well be further improved. That is certainly the case in the AAPL example, as it would have prevented us from taking the overbought signal that occurred at the end of June.
That’s why the AAPL chart, above, includes a line representing the 200-day moving average (the line rising from 300 to about 340). You can see at a glance that AAPL was above its 200 day moving average during the 6 months depicted, and that – if we were being extra conservative – we would only have acted on Williams %R signals that AAPL was oversold, and thus encouraging us to use only bull put spreads.
Interestingly, had we adopted this “rule” of only accepting overbought-oversold signals that put us in the market in the direction of the general trend, we would have had only winning AAPL trades during the 6 months shown.
(B) Support and Resistance as a Filter
I am very comfortable with the 200 day SMA as the sole “filter” (along with, of course, the usual Monthly Income Machine entry criteria) for use with Williams %R.
However, the example AAPL history we are working with also happens to offer us another validating indicator. Notice that all of the “overbought” signals occurred right smack at APPL’s then resistance level of about 354-355, and that once AAPL climbed above the level making it the new support level, all the ensuing oversold signals occurred at this support level!
Summary
Using Overbought/Oversold Williams %R with Monthly Income Machine
- Identify potential trade that meets ALL Monthly Income Machine entry “rules.”
- Favor the trade especially if/when Williams %R signal is given by reaching the necessary 10 to 0 or 90 to 100 point indicating extremely overbought or oversold, respectively.
- Consider the potential trade even more desirable if the signal puts you in the market in the direction of the then general trend as measured by the 200 day Simple Moving Average.
- Set your Maximum Risk Amount (MRA) that will trigger corrective action, just in case.
- Smile !
Want to Learn More?
Eager to know more about The Monthly Income Machine? and . . .
Receive – at no cost – SaferTrader’s entire series of conservative investment power tips and how-to articles like this one? Please fill in your contact below!

Lee Finberg
Options Income Specialist –
Small Risk. Big rewards.
Note: We can – and do – guarantee your satisfaction with “The Monthly Income Machine” detailed how-to blueprint for conservative income investors. No one, however, can guarantee market profits. For a full description of the risks associated with such investments, see Disclaimers.
Thanks, I fond this information helpful
Just got your book.
If this O.B/O.S. idea were strictly followed wouldn’t it be difficult to end up with a Condor? If so, I wonder how bad that would be?? I suspect it’s another trade off: More Conservative vs higher potential.