
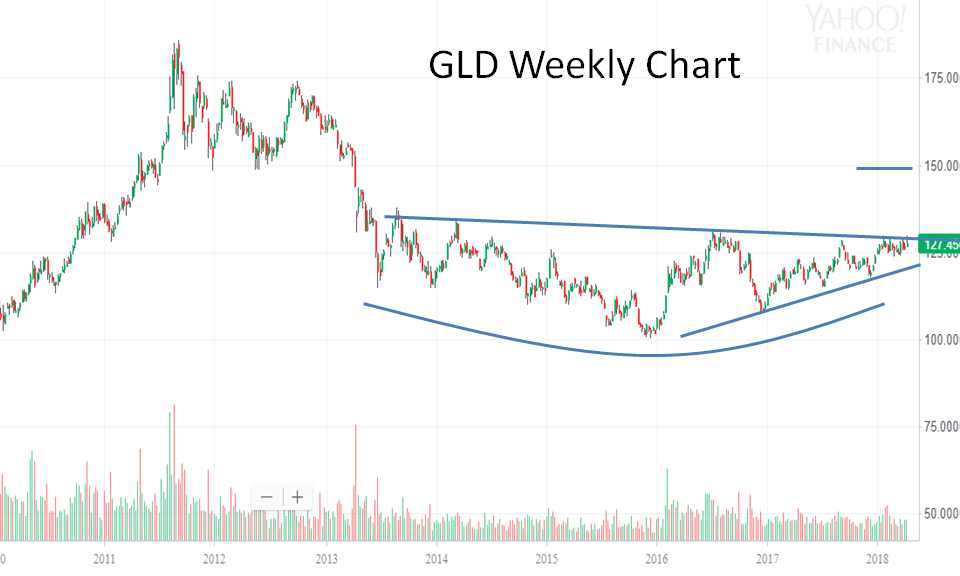
Let’s use the Gold ETF to study the pattern of gold.
Gold has been forming a big bottom since the 2012 crash. The formation of the bottom began in 2013, and it’s pattern is a gigantic head-shoulders bottom. If you just look at the the chart from 2016 to today, its pattern is a triangle in the bottom level. Typically, the longer time a pattern takes to create, more powerful the breakout/breakdown will be. The neckline around 130 has been tested multiple times, and the recent lows have inched up.
Once no one would sell at the neckline, gold will break out and the first target is around 150.