
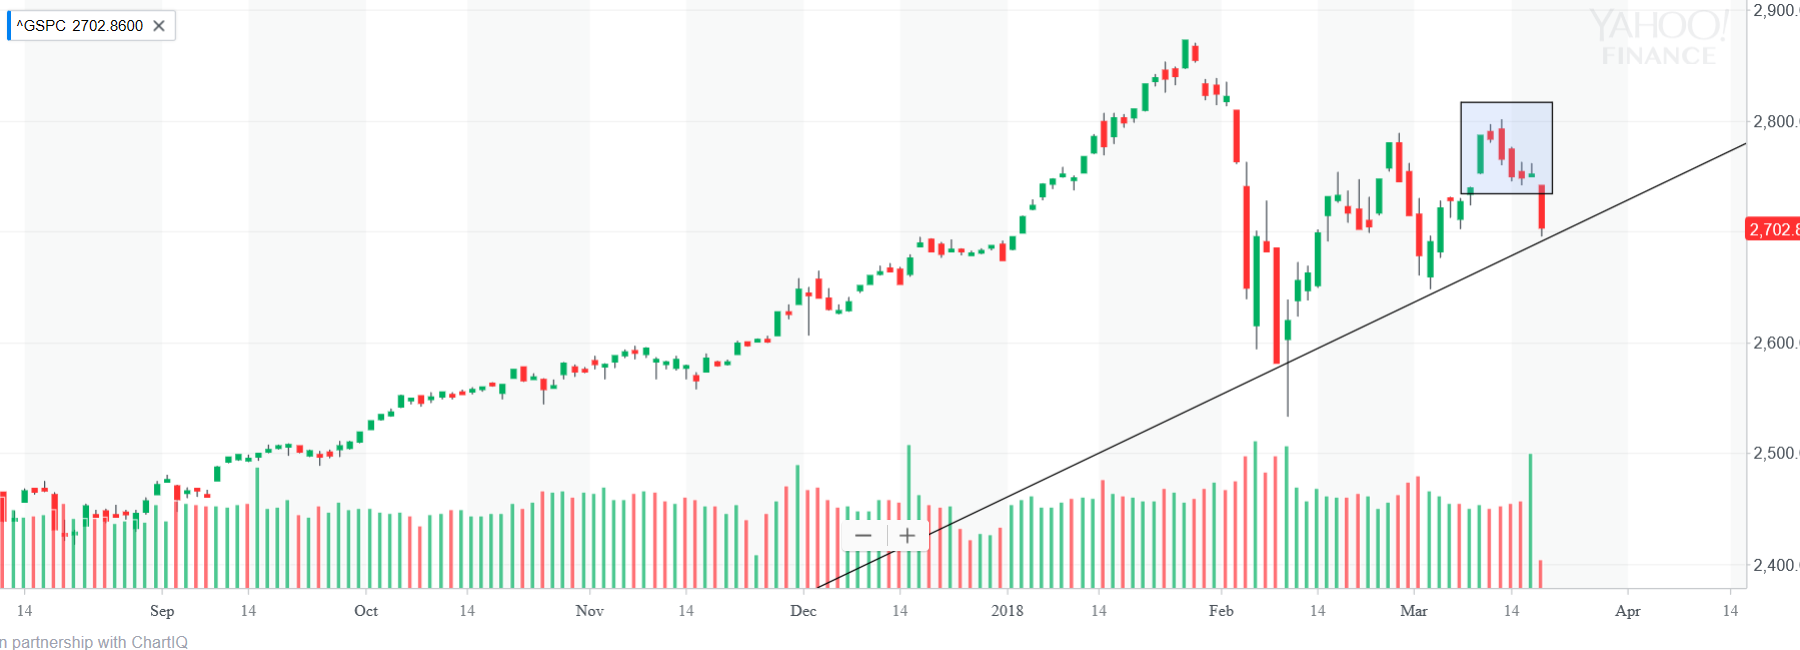
The chart explains itself. S&P 500 forms an M head. Further, the most recent top forms an isolated portion, which signals an island reversal. When we connect the lows in February and in early March, a neck line can be drawn. If S&P 500 cannot stand above the neck line, another selloff will come.